Budget Vs Forecast Vs Actual Chart
Updated Jul 2026
Some links on this page are affiliate links. If you buy through them we may earn a small commission at no extra cost to you. We only recommend what we'd use.
- Distinguish budget, forecast, and actuals
- Understand their purpose in financial planning
- Learn how to use charts for clearer insights
- Choose the right tools for your needs

What is a Budget vs. Forecast vs. Actual Chart?
A budget vs. forecast vs. actual chart visually compares your planned spending (budget), predicted income/expenses (forecast), and what *really* happened (actuals). These charts help pinpoint variances and understand where financial adjustments are needed. They are crucial for effective financial management and control. Budgets typically establish spending limits for a defined period. Forecasts project future financial performance, often based on current trends. Actuals represent the real-world results, reflecting what truly transpired. Visualizing these differences clarifies financial health.Understanding Budgets: Your Spending Plan
Budgets define how you intend to spend your money over a specific period, like a month or a year. They represent a target or a goal for your finances. Creating a budget involves listing income and expenses, then allocating funds to different categories. Reviewing your budget regularly is vital. Developing a budget requires identifying income sources and essential expenses. Then, you assign amounts to categories like housing, food, and transportation. Many budgeting apps exist to simplify this process, but spreadsheets work well too. A well-defined budget provides financial structure.Exploring Forecasts: Predicting the Future
A financial forecast predicts your income and expenses over a future period, often extending beyond your budget timeframe. It’s based on assumptions about market conditions, sales, or other relevant factors. Forecasts are useful for long-term planning and anticipating potential challenges. Creating a forecast involves analyzing historical data and current trends. You then use these insights to project future income and expenses. Reviewers often point out that forecasts are inherently uncertain, so they need regular updates. Sensitivity analysis can reveal how changes affect outcomes.Analyzing Actuals: The Reality Check
Actuals represent the real income and expenses you experienced during a specific period. They provide a crucial benchmark against your budget and forecast. Comparing actuals to your plan highlights areas where you overspent or underspent. Tracking actuals is essential for financial accountability. Gathering accurate actual data requires diligent record-keeping. This might involve tracking bank transactions, credit card statements, and receipts. Many personal finance tools automate this process, simplifying data collection. Analyzing discrepancies between actuals and your plan is key.Why Use a Budget vs. Forecast vs. Actual Chart?
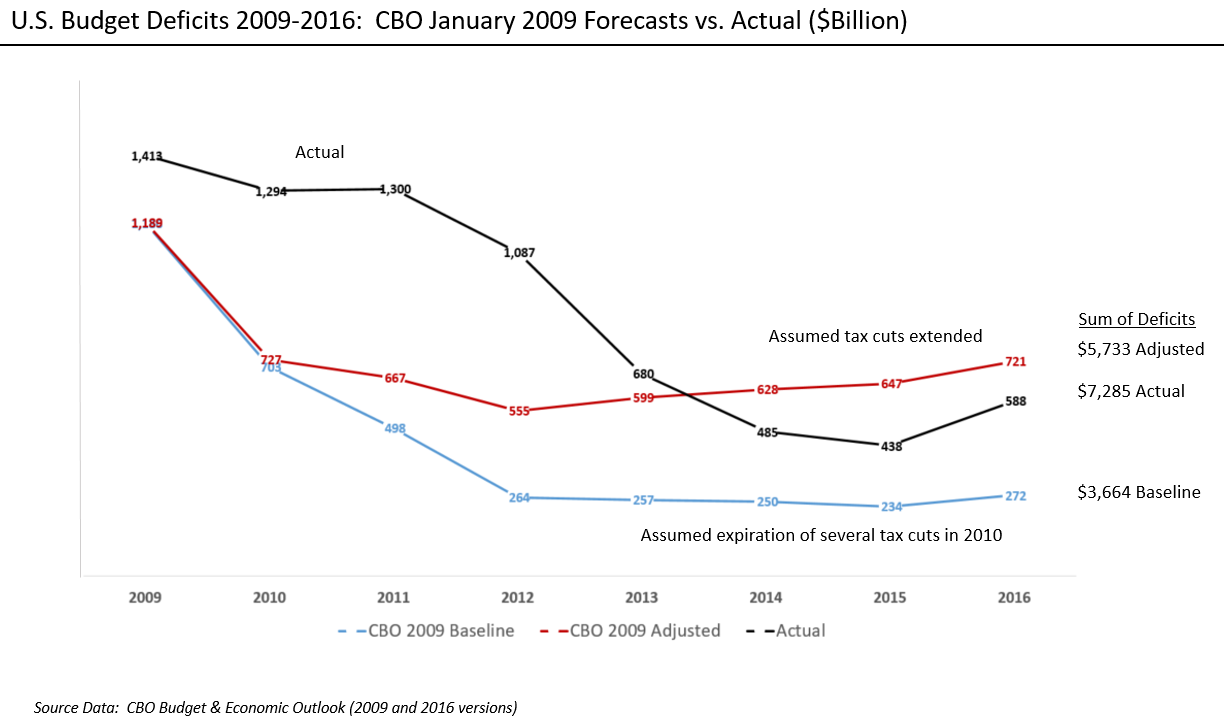
Types of Charts to Visualize Your Data
Several chart types effectively display budget vs. forecast vs. actual data; the best choice depends on the specific information you want to convey. Column charts are popular for comparing discrete values across time periods. Line charts are excellent for showing trends over time. Bar charts clearly illustrate differences between budget, forecast, and actual amounts. Stacked bar charts can show the composition of each category. Reviewers suggest experimenting with different chart types to find what's most intuitive for you. Interactive dashboards offer dynamic analysis.Tools for Creating Budget vs. Forecast vs. Actual Charts
Numerous tools can help you create these valuable charts, ranging from simple spreadsheets to sophisticated financial planning software. Microsoft Excel and Google Sheets are versatile options for basic charting. Dedicated personal finance apps often include built-in reporting features. Specialized financial planning software provides more advanced forecasting and reporting capabilities. These tools often integrate with bank accounts and investment platforms. Some offer automated chart generation and variance analysis. Consider your needs and budget when selecting a tool.| Tool | Best for | Pricing Tier | Standout |
|---|---|---|---|
| Google Sheets | Basic budgeting & simple charts | Free | Accessibility & collaboration |
| Microsoft Excel | Detailed budgeting & custom charts | Part of Microsoft 365 | Powerful data analysis |
| Mint | Beginners; automated tracking | Free (with ads) | Automatic transaction categorization |
| YNAB (You Need a Budget) | Zero-based budgeting; proactive planning | Subscription-based | Envelope budgeting system |
| Quicken | Comprehensive financial management | Subscription-based | Bill tracking & investment analysis |
🛍 Ready to buy? Check current prices on Amazon for the picks in this guide.
**Ranked List of Tools:** 1. **YNAB (You Need a Budget):** Best for disciplined zero-based budgeting; a steeper learning curve but powerful. 2. **Quicken:** A robust, all-in-one solution for managing finances, including investment tracking. 3. **Google Sheets:** Excellent for those comfortable with spreadsheets and seeking a free, collaborative option. 4. **Microsoft Excel:** Similar to Google Sheets, but with more advanced features and potentially a higher cost. 5. **Mint:** A good starting point for beginners, but limited customization and reporting.
Common Pitfalls and How to Avoid Them
Creating and maintaining accurate budget vs. forecast vs. actual charts involves avoiding several common pitfalls. Overly optimistic forecasts are a frequent mistake, leading to disappointment and missed goals. Inconsistent data collection can distort the analysis and render the charts less useful. Failing to regularly review and update your charts is another common error. Life changes and unexpected events necessitate adjustments to your plans. Users often report feeling overwhelmed by the complexity, so start small and gradually add detail. It’s an iterative process.Interpreting Variances: What Do They Mean?
Variances, the differences between budgeted, forecasted, and actual amounts, provide valuable insights into your financial performance. A positive variance in income means you earned more than expected. A negative variance in expenses indicates you spent more than planned. Investigating the root causes of significant variances is crucial. Was the variance due to a one-time event, or does it reflect a systemic problem? Understanding the reasons behind variances allows you to make informed adjustments to your future plans. Regularly reviewing variances is key.FAQ
What’s the difference between a budget and a forecast?
A budget is a plan for how you *will* spend your money, while a forecast predicts how much money you *expect* to earn and spend in the future. Budgets are typically short-term; forecasts are often longer-term.
Why is tracking actuals so important?
Tracking actuals provides a reality check against your budget and forecast. Comparing what you planned versus what happened reveals where adjustments are needed and improves accuracy moving forward.
Can I use a simple spreadsheet for this?
Yes, absolutely! Spreadsheets like Google Sheets or Microsoft Excel are perfectly capable of creating budget vs. forecast vs. actual charts. They offer flexibility, although dedicated software can automate the process.
How often should I review these charts?
Ideally, review your charts monthly. This allows you to catch and correct any issues quickly. A quarterly review is also beneficial for assessing long-term trends and making strategic adjustments.
What if my actuals are consistently different from my budget?
If your actuals consistently deviate from your budget, it’s time to re-evaluate your assumptions. Consider revising your budget or improving your data collection methods to ensure accuracy and relevance.
🛍 See today's best prices on Amazon and grab the option that fits you.